This website has been archived from TrainWeb.org/railengineering to TrainWeb.US/railengineering.
|
Home
|
Curvature
The most important thing to understand is that all curves are typically measured in
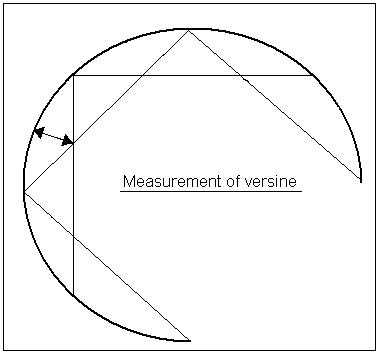
versines. To measure the versine of a curve, several chords have to be measured.
Following this, the points from where the chords cross, to the running edge of the curve
is called the versine. The following diagram emphasises how a versine is measured.
Fig. 64 How the versine of a curve is measured.
Once the versine is known, the radius of the curve can be calculated. If the versines
around a curve are similar or constant, the curve is smooth.
With regards to horizontal and vertical design, if curves are involved, a transition rail
may have to be used. This is typically used where a design incorporates a curve to curve
section, or a straight to curve section.
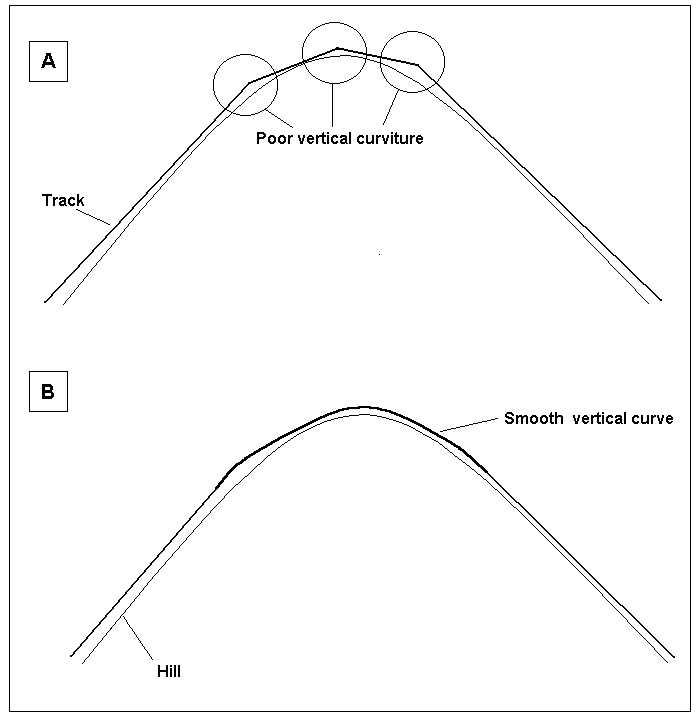
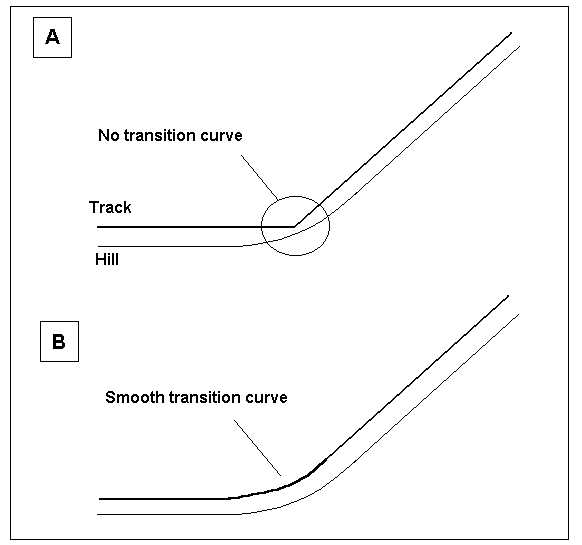
As can be seen in Figs. 65, 66 and 67, the use of a transition rail makes the curve much
smoother. Figs 65 and 66 show how vertical curves are used to run rail over hogs (hill)
and sags (valley). Without the use of transition curves, the train would have a very rough
ride and the rail would be subjected to many unnecessary forces.
Meanwhile, Fig. 67 shows why horizontal curves have to be used. Again, giving a much smoother
ride, there is no unnecessary forces exerted on the rail.
In both cases, the aim is to provide an easy route for the train.
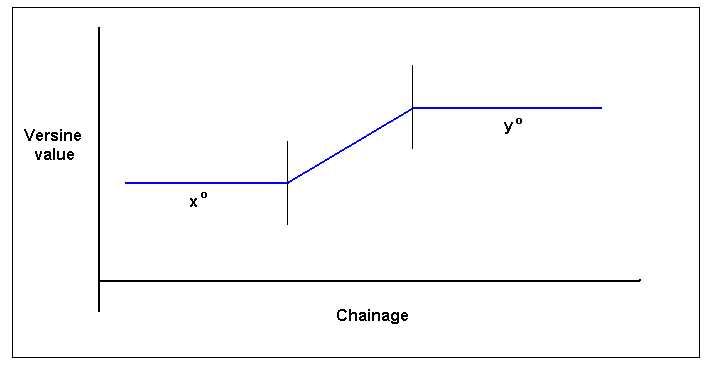
A transition rail is used if two curves of different versines are joined. A graph can be
shown to represent the versine profile of the track. This is seen in Fig. 68. As seen,
one curve of versine x is joined to a second curve of versine y by a length of rail with
increasing versine. Ideally, this is a linear relationship.
|


